Allocation app for iPhone and iPad
Developer: Bradley McCarthy
First release : 31 Jan 2018
App size: 13.7 Mb
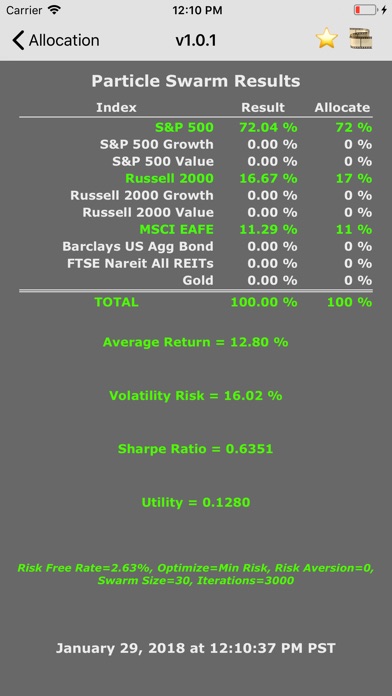
Allocation is a powerful mean-variance portfolio analysis tool which uses a particle swarm optimization routine to determine optimal portfolio allocations based upon your personal appetite for risk.
Allocation provides 10 different indices that you can choose to represent your portfolio. The indices represent the following investment asset classes:
S&P 500 -> Large Market Capitalization U.S. Stocks
S&P 500 Growth -> Large Market Capitalization U.S. Growth Stocks
S&P 500 Value -> Large Market Capitalization U.S. Value Stocks
Russell 2000 -> Small Market Capitalization U.S. Stocks
Russell 2000 Growth -> Small Market Capitalization U.S. Growth Stocks
Russell 2000 Value -> Small Market Capitalization U.S. Value Stocks
MSCI EAFE -> Non-U.S. Developed Markets Stocks
Barclays US Agg Bond -> Investment Grade Bond Market
FTSE Nareit All REITs -> U.S. Listed REITs (Real Estate Investment Trusts) Market
Gold -> The Market Price of Gold
There are many investable mutual funds and exchange-traded funds that seek to mimic the performance of each one of these ten popular indices.
App features include:
1. Annual returns since 1980 for 10 popular indices
2. A powerful Particle Swarm Optimization routine
3. Extensive optimization parameters to represent your personal risk profile
4. Results screen with simulation results, inputs, and time stamp
5. Ability to save full resolution screen captures of results for future reference
Allocation works like this:
1. Choose up to ten different indices that represent asset classes of interest.
2. Input a Risk Free Rate by tapping on its number field and using the pop-up keyboard.
3. Choose the optimization objective (Max Return, Max Sharpe Ratio, Min Risk, or Max Utility.
4. If Max Utility is chosen, you must also set the Risk Aversion number by moving the slider.
5. If you have chosen many indices, you may need to increase the Swarm Size number and/or the Iterations number for the optimization.
6. Tap the optimize button on the indices screen to perform the analysis.
7. Tap the film button to save an image of the results.
8. Rate the app if you like it to help others discover this tool.
Notes:
1. The 10-Year Treasury Note yield is often used for the Risk Free Rate, but you should use whatever interest rate you feel represents it best.
2. The Sharpe Ratio represents the return per unit risk for the portfolio and uses the Risk Free Rate in its calculation.
3. When you are optimizing based on Max Utility, the Risk Aversion number is used as a measure of your aversion to risk. Risk Aversion ranges from 0 to infinity. A Risk Aversion of 0 represents a "Risk Neutral" posture and will give the same result as Max Return. A Risk Aversion of 100 represents a "Very Risk Averse" posture and will approximate the same result as Min Risk. A Risk Aversion setting in-between 0 and 100 can be used to represent your specific risk posture.
I am an engineer, not a financial professional. Everything related to this app reflects my own opinions and should not be considered financial advice.
** I hope you download Allocation and discover its power as an investing tool **


